Here's an example of a basic implementation of a line graph generator in Python using the matplotlib library:
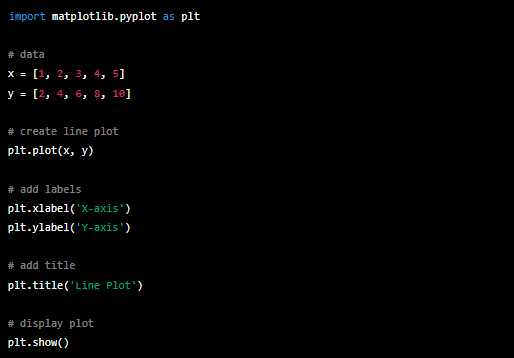
This code uses the matplotlib library to create a line plot of the given x and y data. It starts by importing the library and then it defines the x and y data. The plt.plot(x, y) function is used to create a line plot of the data. Then it adds the labels for the x and y axis and the title for the plot. Finally, it uses plt.show() to display the plot.
You can also customize the plot by adding more features like different color schemes, markers, etc.
To run this code, you will need to have matplotlib library installed on your system and a Python development environment. Some popular options include IDLE (which is included with the Python installation), PyCharm Community Edition, and Visual Studio Code with the Python extension.
No comments:
Post a Comment